Live, byte by byte
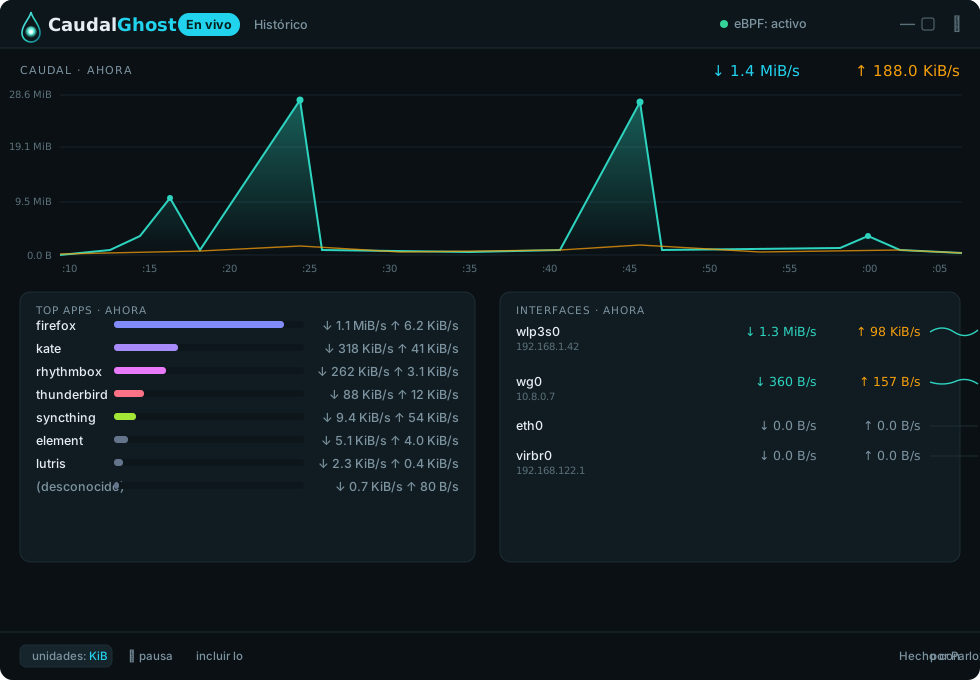
See the flow right now: which app is uploading, which is downloading, in real time.

Discover how much every app and interface is using — live, with history kept forever. All on your machine.
observes · never interferes · your data, your machine
Right-now flow and long-term memory, in the same view.
Who is using what: every program, every network card, no guessing.
Everything stays on your disk. It observes, it never interferes.
Open source code you can read, build, and verify yourself.
We don't ask you to trust us blindly. Every promise has its proof.
Everything it measures is stored in a local SQLite database on your disk. Nothing is transmitted.
Where your data lives →CaudalGhost measures traffic and makes it visible. It does not block it, redirect it, or control it.
How it works →You can read the code, build it, and verify the binary with its SHA-256 checksum.
Code · coming soonYou don't know which app is eating your connection, and finding out by hand is a chore. CaudalGhost measures in the kernel, attributes every byte to its program, and keeps it forever — without touching, blocking, or rerouting any of your traffic.
Clarity about your network, no jargon required: four views that answer "who's using what?"
See the flow right now: which app is uploading, which is downloading, in real time.
Compare today with last week. Every app's usage stays on record.
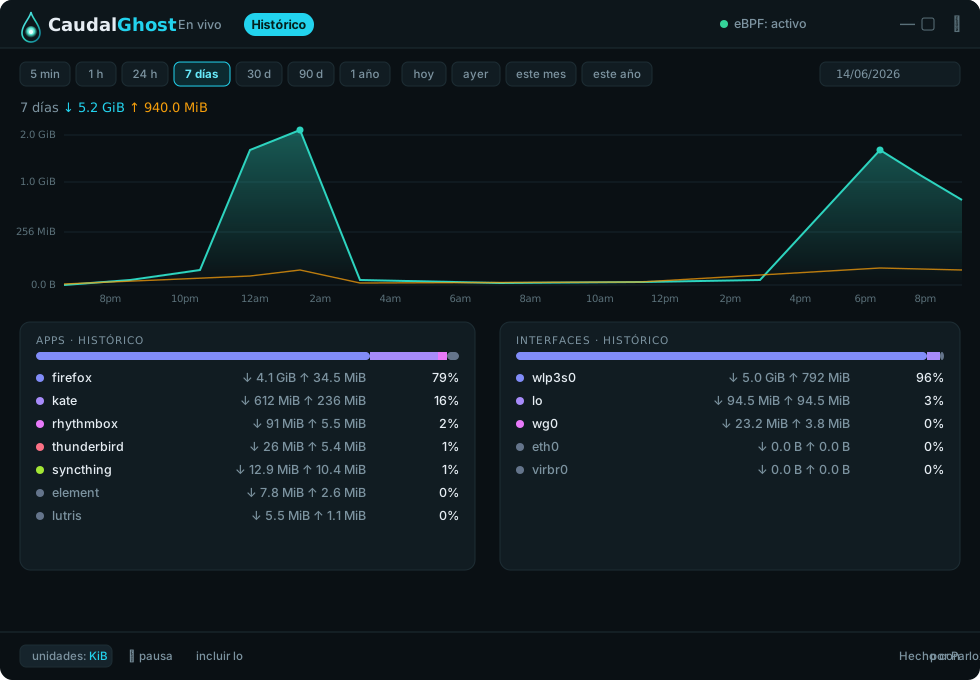
Attributes every byte to its program and to the network card that moved it.
Resolves hosts (DNS) so you can see who each connection is talking to.
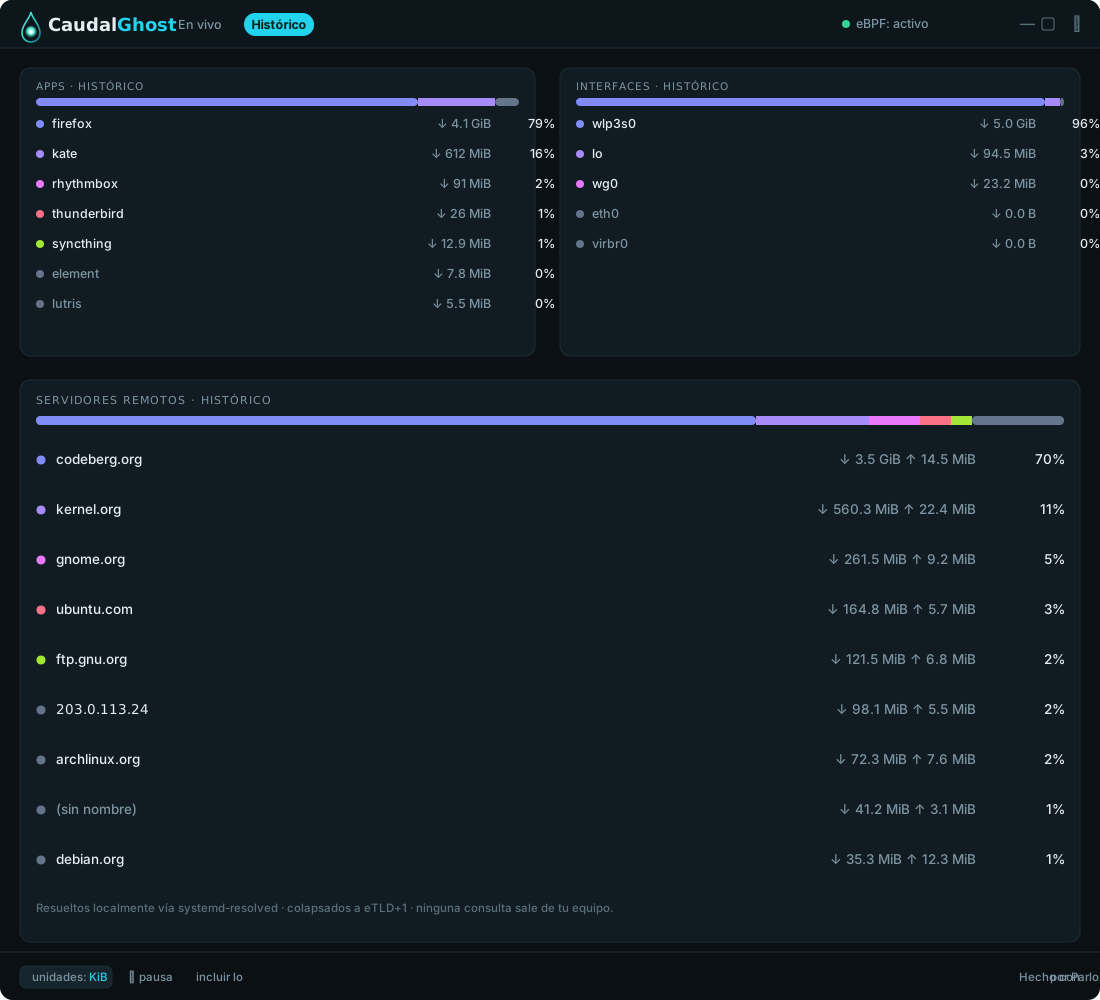
CaudalGhost exists to fill a gap: see — and remember — where your network traffic goes, without anything leaving your machine.
CaudalGhost isn't a pile of loose features — it's a stance on how a network should be measured, with respect for your machine and your data. These nine pieces define it.
It measures the machine it runs on — desktop or server — and only that one.
Every byte, tied to its program and to the server or local machine it talks to.
The daily layer is kept for good; memory doesn’t expire.
A watcher that stays out of your machine’s way.
Purely observational: it measures, it doesn’t interfere.
Your data stays on your machine; nothing phones home.
CLI, TUI, and GUI over the same daemon.
Little code, few dependencies, nothing spare.
AGPL-3.0, open source top to bottom.
Two editions, one engine. No email, no account, no sign-up.
For your Linux desktop (Kubuntu, CachyOS…).
sudo apt install ./caudalghost_0.7.4-1_amd64.deb We're preparing the first public release — check back soon.
Verify checksum (SHA-256) →For your server or homelab (bare-metal Ubuntu Server).
sudo apt install ./caudalghost-server_0.7.4-1_amd64.deb We're preparing the first public release — check back soon.
Verify checksum (SHA-256) →No. CaudalGhost only measures and displays your traffic. It doesn't block, filter, or redirect anything. It observes, it never interferes.
The daemon needs to start with privileges (sudo) to read the kernel counters (eBPF). It is open source and auditable; you can see exactly what it does.
In a local SQLite database, on your own disk. Nothing is transmitted to any server. Your data, your machine.
No clouds, no accounts, no surprises. Just you and your data.
Download CaudalGhost