
CLI Guide
The CLI ships in both editions (desktop and server). Every command works without sudo once the service is installed.
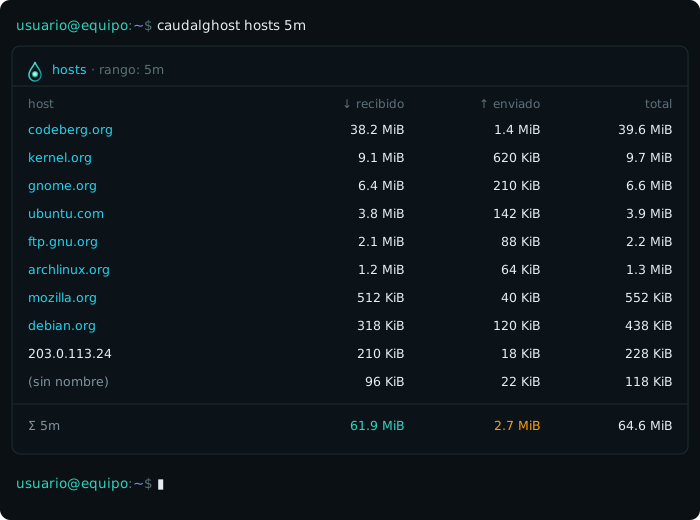
CLI example — remote servers over the last 5 minutes (once it’s done, you’re back at the prompt):
Time ranges
Section titled “Time ranges”Several subcommands accept a range as an argument. Valid values are:
| Range | Meaning |
|---|---|
5m, 1h, 24h, 7d, 30d, 90d, 365d | Relative window going back from now |
hoy | From midnight to now |
ayer | The entire previous calendar day |
este-mes | From the 1st of the current month to now |
este-anio | From January 1st of the current year to now |
dia:YYYY-MM-DD | A specific calendar day, e.g. dia:2026-06-30 |
rango:YYYY-MM-DD:YYYY-MM-DD | A specific date range, e.g. rango:2026-06-01:2026-06-30 |
A malformed range (invalid date, reversed interval…) ends the command with exit code 5.
caudalghost ping
Section titled “caudalghost ping”Checks that the CLI can reach the daemon over the Unix socket. Handy in scripts before requesting data.
caudalghost pingcaudalghost now
Section titled “caudalghost now”Traffic right now, per interface (per-second rates).
caudalghost nowUse --seconds to control the instant-sampling window (a handful of seconds by default):
caudalghost now --seconds 5caudalghost total
Section titled “caudalghost total”Cumulative totals per interface for a given range.
caudalghost total 24hinterfaz rx tx totalwlan0 842 MiB 119 MiB 961 MiBeth0 12 MiB 3 MiB 15 MiBΣ total 854 MiB 122 MiB 976 MiBcaudalghost top
Section titled “caudalghost top”Top applications by network usage, for a range or for an instant window.
caudalghost top 24happ rx tx totalfirefox 612 MiB 88 MiB 700 MiBthunderbird 140 MiB 21 MiB 161 MiBsyncthing 45 MiB 39 MiB 84 MiBΣ total 797 MiB 148 MiB 945 MiBIt also accepts an instant window via --seconds, instead of a range:
caudalghost top --seconds 10The (otros) (“other”) row never appears in top: every app is listed under its own name.
caudalghost hosts
Section titled “caudalghost hosts”Remote servers (by hostname), grouped by root domain, for a given range.
caudalghost hosts 5mhost rx tx totalcdn.ejemplo.net 38 MiB 2 MiB 40 MiBapi.ejemplo.org 9 MiB 4 MiB 13 MiB(otros) 3 MiB 1 MiB 4 MiBΣ total 50 MiB 7 MiB 57 MiBUnlike top, here an (otros) (“other”) row can appear: it groups the hosts that don’t make the per-app top list.
You can narrow it down to a single application with --app:
caudalghost hosts 24h --app firefoxcaudalghost serie
Section titled “caudalghost serie”How total throughput evolves over a range, in time buckets (terminal sparkline + table).
caudalghost serie 24hBucket size is controlled with --bucket (minute, hour, or day):
caudalghost serie 7d --bucket hourcaudalghost live
Section titled “caudalghost live”Interactive terminal panel (TUI): apps, interfaces, and hosts, live or over a historical range, with per-app→hosts drill-down, a range selector, and threshold highlighting.
caudalghost live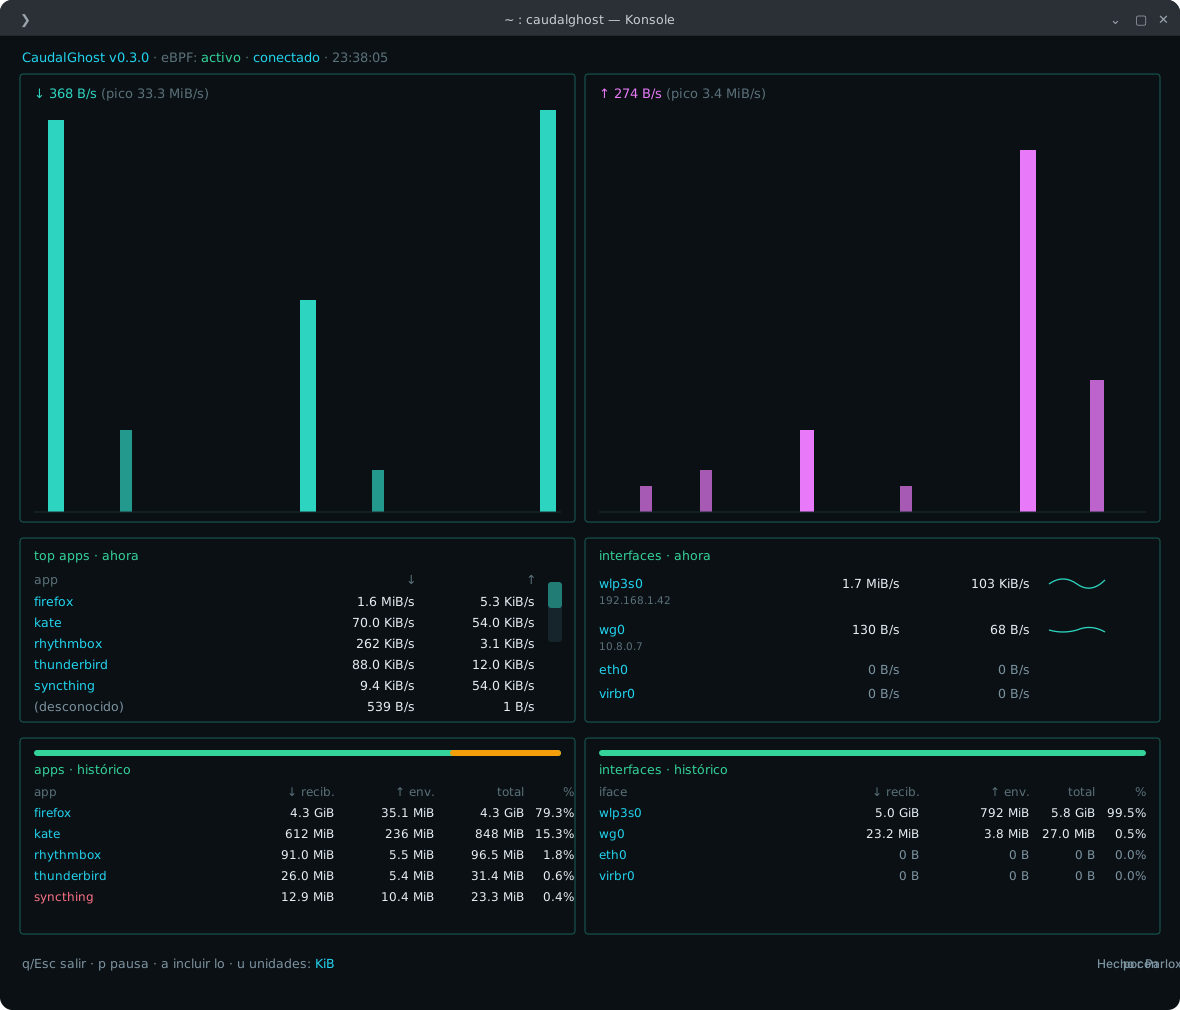
Inside live you can move between apps, interfaces, and hosts, drill into an app to see which hosts are driving its traffic, switch ranges without leaving the panel, and visually flag usage that crosses a threshold. Exit with the key shown right in the panel.
Output flags
Section titled “Output flags”These flags work on ping, now, total, top, hosts, and serie (not on live, which is a separate interactive panel):
| Flag | Effect |
|---|---|
-o, --output table|json|csv|ndjson | Output format. Defaults to table |
--json | Shorthand for -o json |
-u, --units binary|decimal|bits | Units: binary (KiB, MiB…), decimal (KB, MB…), or bits (Kbps, Mbps…) |
-n, --limit N | Limits the number of rows |
--sort <col> | Sorts by a column (e.g. --sort total) |
-r, --reverse | Reverses the sort order |
--fields a,b,c | Projects only those columns — csv, json, and ndjson only |
--no-header | Omits the header row — csv only |
--watch | Refreshes the table at a set interval — only with -o table |
--interval SECS | Refresh interval for --watch |
--quiet | Suppresses any output besides the result |
--no-color | Disables color (also respects the NO_COLOR variable) |
Table columns are lowercase: app, host, or interfaz depending on the command, plus rx, tx, and total, with a final Σ total row.
JSON example (includes "schema":1 so you can version your parsing):
caudalghost top 24h -o json{"schema":1,"rango":"24h","filas":[ {"app":"firefox","rx":641925120,"tx":92274688,"total":734199808}, {"app":"thunderbird","rx":146800640,"tx":22020096,"total":168820736}],"total":{"rx":835055616,"tx":155189248,"total":990244864}}CSV example with column projection:
caudalghost hosts 24h --fields host,total -o csvhost,totalcdn.ejemplo.net,41943040api.ejemplo.org,13631488Connecting to a daemon at another path
Section titled “Connecting to a daemon at another path”If you’re running a manual daemon with a different socket (advanced use), pass it via --socket or the CAUDALGHOST_SOCKET environment variable:
caudalghost live --socket /run/caudalghost/caudalghost.sockexport CAUDALGHOST_SOCKET=/run/caudalghost/caudalghost.sockcaudalghost nowOn a standard install this isn’t needed: the CLI auto-detects the service’s socket.
Exit codes
Section titled “Exit codes”| Code | Meaning |
|---|---|
0 | OK |
1 | Other error |
2 | Invalid usage (malformed flags or arguments) |
3 | Daemon unreachable |
4 | Business error (e.g. nonexistent app or host) |
5 | Invalid time range |
Shell completion and man page
Section titled “Shell completion and man page”The package installs command completion for bash, zsh, and fish, plus a man page:
man caudalghostInstalled version
Section titled “Installed version”caudalghost --versionShows the version, the git hash, and the build date — handy for reporting which build you’re on when you ask for help.